RESEARCH
The Division of Industrial Mathematics and Statistics aims to address statistical problems in various sciences and industries by proposing mathematical methods to solve various social problems. Applications include natural sciences, such as energy, materials, earth, and social sciences, such as official and psychological statistics. Some methods have been implemented as software packages and are used in research and practice in other fields. Specific research interests include theoretical research in mathematical statistics and machine learning, such as sparse estimation, robust estimation, and subregional estimation, as well as cross-disciplinary research with informatics, geometry, and algebra.
Development of energy big data analysis methods
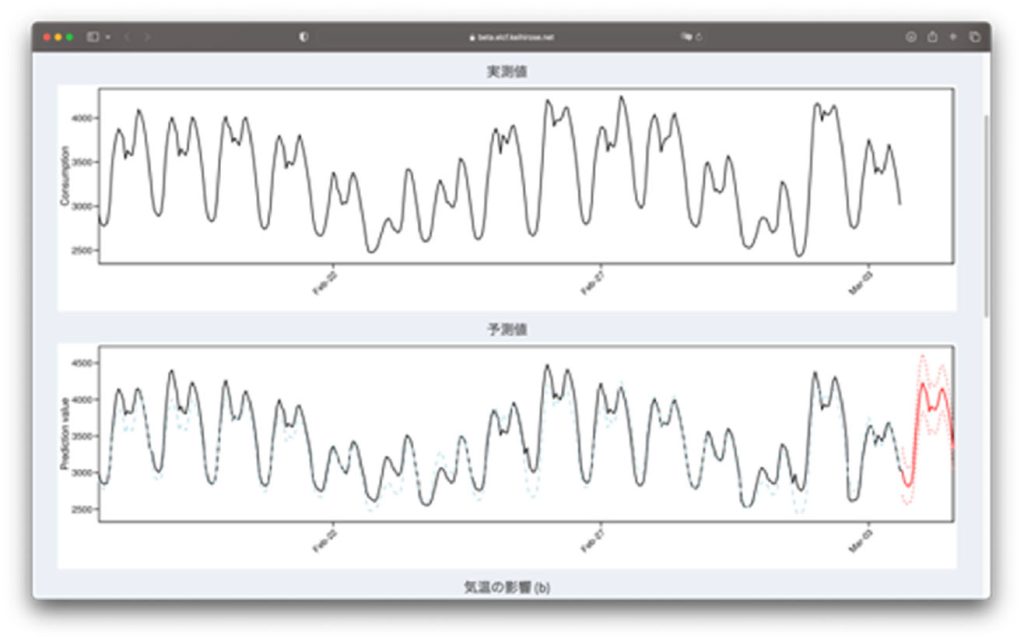
In recent years, the energy situation in our country has constantly been changing due to the situation in Ukraine and other factors, and energy issues such as soaring electricity costs are becoming more and more familiar to us. Under such circumstances, renewable energy sources such as solar power and offshore wind power are being considered, but there is the problem of unstable power generation. Therefore, it is necessary to accurately forecast power generation, electricity demand, electricity prices, etc. Therefore, we are constructing highly accurate forecasts using advanced methods such as generalized Lasso and useful forecast intervals for risk management. In addition, we are also creating software that allows easy use of these forecasting algorithms.
Related Projects : https://coi.kyushu-u.ac.jp/en/ , https://recow.kyushu-u.ac.jp
Development of material data analysis methods
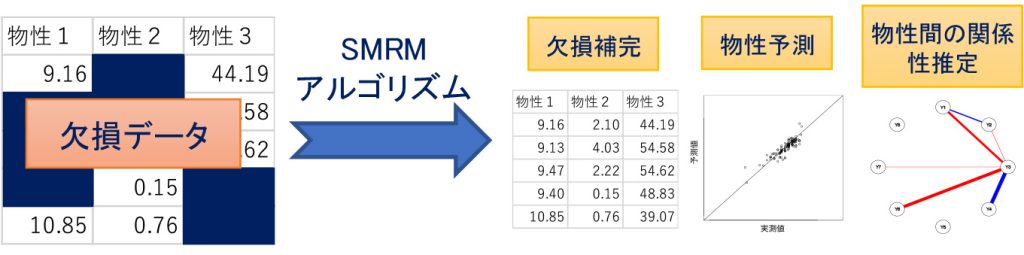
Material development has traditionally been based on experimental results under various conditions, but in recent years it is increasingly being driven by data science. In order to predict physical properties such as adhesive strength, it is necessary to construct statistical models. Especially when data sharing among companies is difficult, sufficient sample size is often unavailable. Moreover, data may be missing. Therefore, we are developing a statistical analysis method to make accurate predictions from a small sample, even when there are missing measurements. In addition, since variations occur between experiments, we are also developing methods to estimate the physical properties and the variations. We are currently promoting this research and its social implementation in the CREA project of the Future Society Creation Project.
Related Projects : https://crea.kyushu-u.ac.jp/group/廣瀬-慧-グループ/
Topological data analysis and machine learning
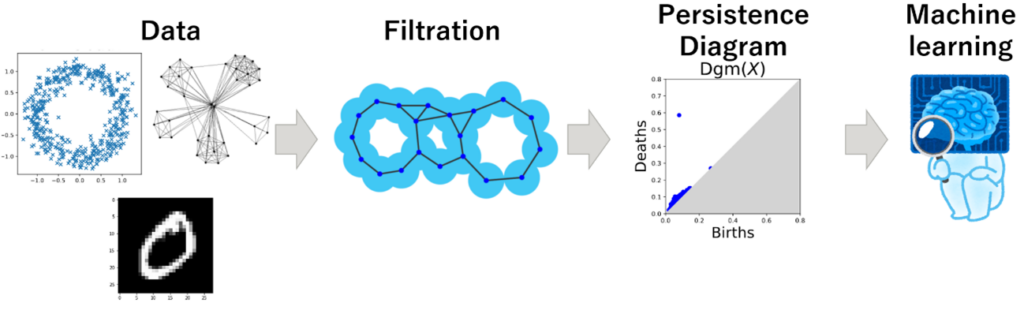
Topological data analysis (TDA) is a method to extract “rough shapes” of data, which is a relatively new method developed around 2000. Currently, it has been applied to material science data and medical data.
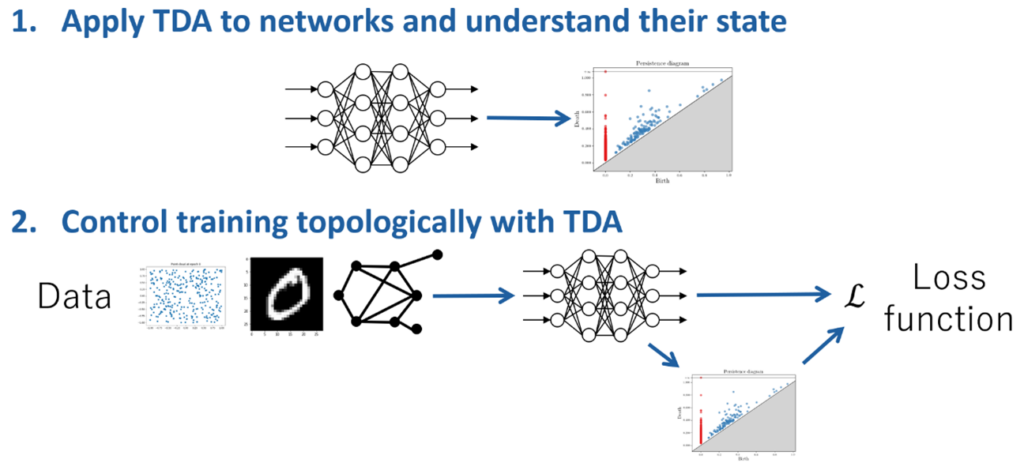
In recent years, TDA has been developed in combination with machine learning. We developed methods to transform topological features for inputting them into neural networks and to learn such topological feature extraction by neural networks. In addition, we have also been interested in applying TDA not only to data, but also to learners, such as neural networks, so that we can understand the state of the learners or control training topologically. These studies have been conducted in collaboration with Fujitsu Research and Inria (France).
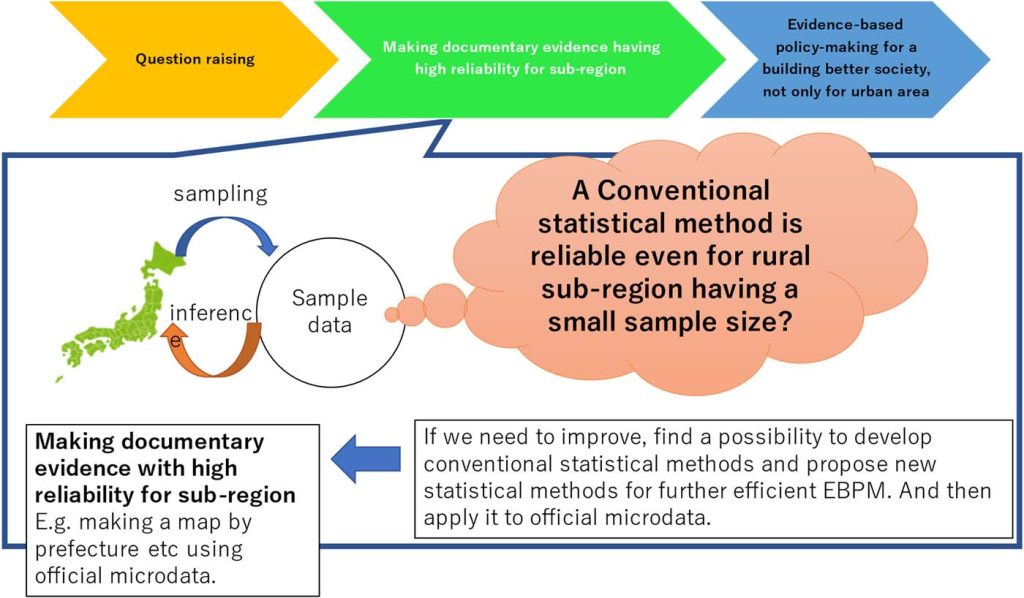
Theoretical study of small area estimation method and its application
An estimation for each area has advantages in carefully ascertaining the actual situation. For example, suppose a case in which one is interested in estimating characteristic values, not only for the whole of Japan but also for smaller geographic areas. However, the sample size within each area may be smaller, so some estimation methods based solely on information within each area might become less reliable. In fact, there are some possibilities to improve to gain more efficiency when using mixed effects models, empirical Bayesian methods, and Bayesian frameworks. Nevertheless, existing methods still have some concerns on the practical side. Therefore, we have been developing new estimation methods while considering both perspectives of theory and application.
Not only the development of methods, but we are also interested in applying such estimation methods to applied fields. For example, we are now pursuing the possibility of contributing to Evidence-Based Policy Making (EBPM) in Japan from statistical science. Mainly we are involved in research projects on tourism statistics and the estimation of poverty rates using official microdata (https://www.e-stat.go.jp/microdata/). We also have been working on a theoretical study of statistical disclosure control.
External collaboration, etc.
- Education and Research Center for Mathematical and Data Science, Cooperating Faculty
https://mdsc.kyushu-u.ac.jp/ - Fukuoka Prefecture Data Utilization Advisor
Development and application of analytical methods with robustness against outliers
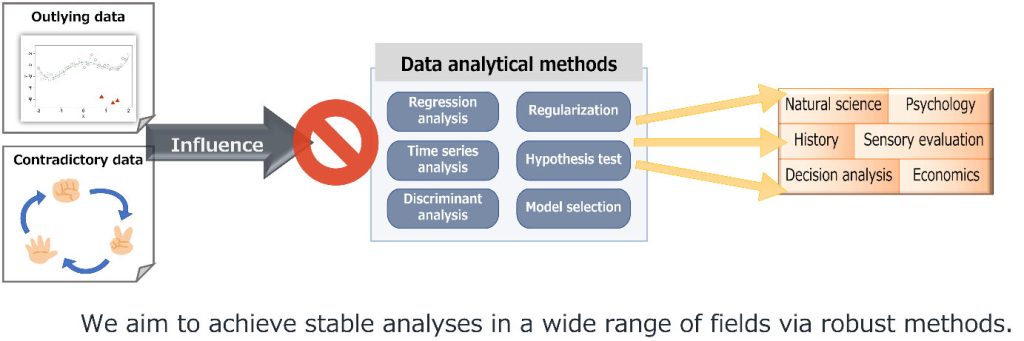
In considering management strategy, it is important to analyze customer surveys regarding products and services properly. However, ways of feeling of humans are not always consistent mechanically. It is quite possible that there are some extreme responses that differ from the majority, or contradictory responses such as the response “A is preferred over C” from an individual who have answered “B is preferred over A” and “C is preferred over B”. When such particular responses (outliers) are mixed in the observation, many general analytical methods tend to be affected by the outliers and lead to inadequate conclusions. Therefore, we are developing “robust” statistical methods that can analyze the data stably, whether outliers are contaminated in the observation or not. We have introduced robust analytical methods relative to conventional ones, for example, a statistical model that describe causal relationships, and models that express human preferences.
Research on statistical model selection
In a wide range of fields, we often face the problem of selecting a best statistical model that describes a phenomenon appropriately. The well-known model selection methods are the information criteria including the AIC and the BIC. Selection methods based on sparse regularization like the Lasso are also applied to various problems. Note that, each of these methods has different features and weaknesses, and it is not always the best to use only one method. Therefore, it is significant to consider the appropriate selection method that can select the appropriate model according to each field, by examining the data to be analyzed and investigating the theoretical properties of the selection methods. We have conducted studies, for instance, that detected the individual characteristics that influence the way of feeling of tastes via the information criterion, and that determined a model for describing the standard of judgement of decision making via a selection method with robustness against outliers.
Theoretical Studies in Factor Analysis
Factor analysis is a statistical technique with a long history, first proposed by Charles Spearman in 1904. Originally used for questionnaire and test data obtained in psychology and social sciences, factor analysis has recently been used as a method of dimensionality compression of high-dimensional data in various fields, including economics, life sciences, and materials science. Mathematically, it can be regarded as a special case of state-space models and neural networks, and it forms the basis of all statistical models. Therefore, a thorough basic study of factor analysis can lead to the development of statistics and machine learning.
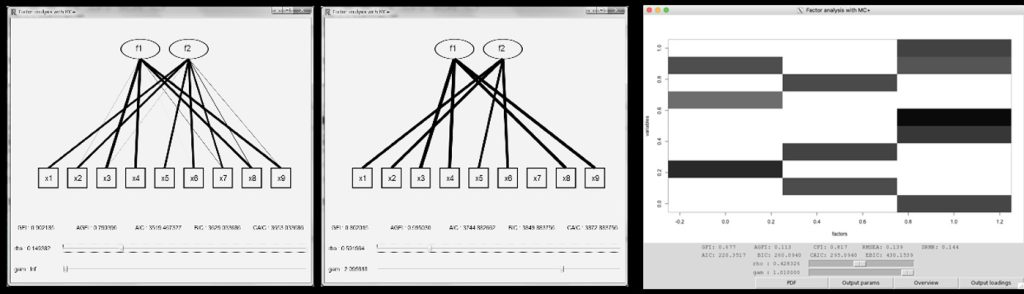
In factor analysis, factor rotation has been widely used to interpret factors for about three-quarters of a century. When this method is analyzed based on the homotopy method, it was found that it can be theoretically shown that the regularization method is a generalization of the factor rotation. This provides theoretical support for sparse estimation in factor analysis. Therefore, we have proposed sparse factor analysis based on various sparse regularization methods, and we have created the R package fanc so that anyone can perform it. This package can compute and visualize parameter estimates and is used in empirical studies by statisticians and researchers in other fields.
Recently, through collaboration with Dr. Ryoya Fukasaku (Kyushu University), Dr. Yutaro Kayada (Nagasaki University), and Dr. Keisuke Teramoto (Hiroshima University), we are pursuing a challenging research project: solving the maximum likelihood solution of factor analysis algebraically to understand its geometric structure.
Bridge between measurements and mathematical modeling via Bayesian inference
As highlighted by Kepler’s laws of planetary motion since the 17th century, mathematical modeling that describes observed data using simple formulas has deepened our understanding of various physical phenomena. However, observed data are often beyond our understanding in modern science, which makes full use of advanced measurement technologies to capture more complex phenomena. My grand challenge is establishing principles of modeling rooted in observed data to provide guidelines for understanding all phenomena without ambiguity. I am exploring the mathematics of a statistical method called Bayesian inference and promoting empirical research through collaboration with researchers in condensed matter physics.
|
|
Related projects:
・Establishing the Solid Foundation for Innovative Measurement and Analysis Process / Innovation in a guiding principle for modeling based on observed data
Press releases:
・Intrinsic regularization effect in Bayesian nonlinear regression scaled by observed data